技术交易系统新概念笔记
介绍
本文是本人在阅读了《技术交易系统新概念》所作的笔记。
开始
目录
记录一下目录:
第一章 基本概念
第二章 抛物式时间/价格交易系统
第三章 波动交易系统
第四章 动向指标
第五章 动量概念-趋势平衡点交易系统
第六章 相对强弱指数
第七章 趋势-回调交易系统
第八章 摆动指标-短线交易系统
第九章 期货品种选择指标CSI
第十章 资金管理
基本概念
这里用到的一些概念会贯穿所有章节使用,需要提前记好。
LOP | HIP
- LOP
其相邻的两根K线的最低价都高于其最低价
- HIP
其相邻的两根K线的最高价均低于其最高价
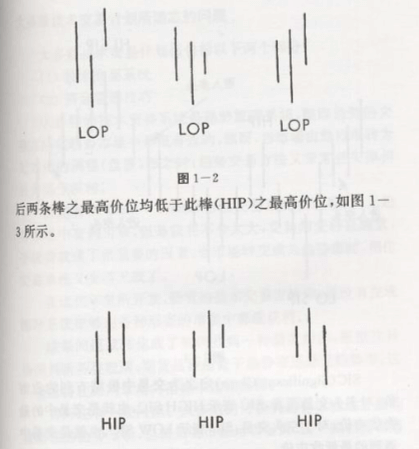
SIP(HI SIP | LO SIP)
简单来说应该就是最高和最低价格的意思吧。
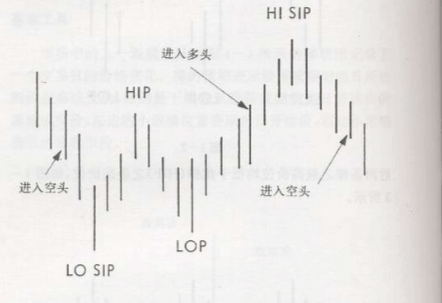
SIC
表示交易中最有利的收盘价。
多头表示最高价。
空头表示最低价。
SAR
停止反转点,表示停止现有头寸,反方向操作。
TR
真实价格范围
去下列值中的最大值
- 最高价与最低价的差
- 最高价与昨日收盘价的差
- 最低价与昨日收盘价的差
MOCK模板
这里简单记录一下javascript实现的一个代码任务运行模板(其实就是怕自己忘记😁 )
1
2
3
4
5
6
7
8
9
10
11
12
13
14
15
16
17
18
19
20
21
22
23
24
25
26
27
|
const DATA_SOURCE = []
function getHistoryData(start, end) {
const date = new Date()
return [{
high,
open,
low,
close,
date: `${date.getFullYear()}-${date.getMonth() + 1}-${date.getDate()}`
}]
}
function getTR(currentData, yestodayData) {
const abs = Math.abs
return Math.max(abs(currentData.high - currentData.low), abs(currentData.high - yestodayData.close), abs(currentData.low - yestodayData.close))
}
function dailyFunction() {
}
|
抛物式时间/价格交易系统
个人认为:
非常偏向数学方法的趋势跟踪系统。
只要记住他的计算功能,就非常容易完成整个系统。
马上就可以尝试使用代码完成系统。
记住几个关键的参数:
- AF
加速因子[0.02-0.2]
当日创下价格新高则AF+0.02(多头为新高,空头为新低)
- SAR
停止反转点
- SIP
价格极值
- EP
此次交易开始的最极值(多头为最高,空头为最低)。
明日SAR = 今日SAR + AF(今日最高价 - 今日SAR)
规则
- 入市时机
价格突破SAR
- 建仓第一天
SAR = 前一次交易SIP
- 第一天之后
多头:明日SAR = 今日SAR + AF(最高价 - 今日SAR)
空头:明日SAR = 今日SAR - AF(最低价 - 今日SAR)
- SAR不允许出现在前一日或今日价格区域
多头:明日SAR不能大于昨日或今日最低价,大于则明日SAR = min(今日最低价,明日最低价)
空头:明日SAR不能小于昨日或今日最高价,小于则明日SAR = max(今日最高价,明日最高价)
1
2
3
4
5
6
7
8
9
10
11
12
13
14
15
16
17
18
19
20
21
22
23
24
25
26
27
28
29
30
31
32
33
34
35
36
37
38
39
40
41
42
43
44
45
46
47
48
49
50
51
52
53
54
55
56
57
58
59
60
61
62
63
64
65
66
67
68
69
70
71
72
73
74
75
76
77
78
79
80
81
82
83
84
85
86
87
88
89
90
91
92
93
94
95
96
97
98
99
100
101
102
103
104
105
106
107
108
109
110
111
112
113
114
115
116
117
118
119
120
121
122
123
124
125
126
127
128
129
130
131
132
133
134
135
136
137
138
139
140
141
142
143
144
145
146
147
148
149
150
151
152
153
154
155
156
157
158
159
160
161
162
163
164
165
166
167
168
169
170
171
172
173
174
175
176
177
178
179
180
181
182
183
184
185
186
187
188
189
190
191
192
193
194
195
196
197
198
199
200
201
202
203
204
205
206
207
208
209
210
211
212
213
214
215
216
217
218
219
220
221
222
223
224
225
226
227
228
229
230
231
232
233
234
235
236
237
238
239
240
241
242
243
| let DATASOURCE: {
state: 1 | -1
dailyData: {
date: string
open: number
high: number
low: number
close: number
SAR: number
EP: number
EP_SAR: number
AF: number
AF_DIFF: number
}[]
} = []
let MOCK_DATASOURCE = []
function getHistoryData(start, end) {
const date = new Date()
return [{
high,
open,
low,
close,
date: `${date.getFullYear()}-${date.getMonth() + 1}-${date.getDate()}`
}]
}
function getBeforeWeekPeak() {
let startDate
let endDate
if(!MOCK_DATASOURCE.length) {
const historyData = getHistoryData()
let peakData
let peakIndex
if(true) {
historyData.forEach((history, index) => {
if(!peakData || history.high > peakData.high) {
peakData = history
peakIndex = index
}
})
const enterDate = historyData.slice(peakIndex, peakIndex + 4)
const SAR = peakData.high
const EP = enterDate.low
const EP_SAR = Math.abs(SAR - EP)
MOCK_DATASOURCE.push({
state: -1,
dailyData: [
date: enterDate.date,
open: enterDate.open,
high: enterDate.high,
low: enterDate.low,
close: enterDate.close,
SAR,
EP,
EP_SAR,
AF: 0.02,
AF_DIFF: EP_SAR * 0.02
]
})
}
else {
historyData.forEach((history, index) => {
if(!peakData || history.low < peakData.low) {
peakData = history
peakIndex = index
}
})
const enterDate = historyData.slice(peakIndex, peakIndex + 4)
const SAR = peakData.low
const EP = enterDate.high
const EP_SAR = Math.abs(SAR - EP)
MOCK_DATASOURCE.push({
state: 1,
dailyData: [
date: enterDate.date,
open: enterDate.open,
high: enterDate.high,
low: enterDate.low,
close: enterDate.close,
SAR,
EP,
EP_SAR,
AF: 0.02,
AF_DIFF: EP_SAR * 0.02
]
})
}
}
}
function dailyFunction(options={
mock: false,
date: null
}) {
const { mock, date } = options
const _DATASOURCE = mock ? MOCK_DATASOURCE : DATASOURCE
const todayData = getHistoryData(date, date)
const newDailyData = {
...todayData,
}
if(!_DATASOURCE.length) {
return getBeforeWeekPeak()
}
const lastTradeNote = _DATASOURCE[_DATASOURCE.length - 2]
const currentTradeNote = _DATASOURCE[_DATASOURCE.length - 1]
const { dailyData, state } = currentTradeNote
if(!dailyData.length) {
if(!!lastTradeNote && Array.isArray(lastTradeNote.dailyData) && lastTradeNote.dailyData.length) {
const { dailyData, state } = lastTradeNote
newDailyData.SAR = dailyData[dailyData.length - 1].EP
newDailyData.EP = state === 1 ? newDailyData.high : newDailyData.low
}
}
else {
const yestodayData = dailyData[dailyData.length - 1]
const beforeYestodayData = dailyData[dailyData.length - 2] || {
low: 999999,
high: -1
}
if(state === 1) {
newDailyData.SAR = yestodayData.SAR + yestodayData.AF_DIFF
const lessThenPrize = Math.min(yestodayData.low, beforeYestodayData.low)
newDailyData.SAR = newDailyData.SAR === Math.min(lessThenPrize, newDailyData.SAR) ? newDailyData.SAR : lessThenPrize
newDailyData.EP = Math.max(yestodayData.EP, newDailyData.high)
}else {
newDailyData.SAR = yestodayData.SAR - yestodayData.AF_DIFF
const greatThenPrize = Math.max(yestodayData.high, beforeYestodayData.high)
newDailyData.SAR = newDailyData.SAR === Math.max(lessThenPrize, newDailyData.SAR) ? newDailyData.SAR : lessThenPrize
newDailyData.EP = Math.min(yestodayData.EP, newDailyData.low)
}
}
newDailyData.EP_SAR = Math.abs(newDailyData.SAR - newDailyData.EP)
newDailyData.AF = newDailyData.AF || 0.02
if(state === 1) {
newDailyData.AF += newDailyData.high > newDailyData.EP ? 0.02 : 0
}else {
newDailyData.AF += newDailyData.low < newDailyData.EP ? 0.02 : 0
}
newDailyData.AF = Math.min(0.2, newDailyData.AF)
newDailyData.AF_DIFF = newDailyData.AF * newDailyData.EP_SAR
const isMultiBreak = state === 1 && newDailyData.low < newDailyData.SAR
const isEmptyBreak = state === -1 && newDailyData.high > newDailyData.SAR
if(isMultiBreak || isEmptyBreak) {
newDailyData.AF = 0.02
newDailyData.SAR = newDailyData.EP
newDailyData.EP = state === 1 ? newDailyData.low : newDailyData.high
newDailyData.EP_SAR = Math.abs(newDailyData.SAR - newDailyData.EP)
newDailyData.AF_DIFF = newDailyData.EP_SAR * newDailyData.AF
console.log((state === 1 ? '多头' : '空头') + '价格发生突破')
_DATASOURCE.push({
state: -1,
dailyData: [
{
...newDailyData,
}
]
})
}
else {
console.log('今日价格数据:' + JSON.stringify(newDailyData))
_DATASOURCE[_DATASOURCE.length - 1].dailyData.push(newDailyData)
}
}
function clearData() {
DATASOURCE = {
state: 1,
dailyData: []
}
MOCK_DATASOURCE = {
state: 1,
dailyData: []
}
}
|
波动交易系统
也是一个趋势跟踪的系统。
根据市场的波动性来作出相应的操作。
ATR计算

ATR_t是当日平均真实价格范围,ATR_p是前一日的平均真实价格范围。
TR是当日真实价格范围。
上述计算是根据七个交易日为标的做的计算。
ATR_p即将加上今日以及前6个交易日的真实价格范围相加,并除7得出的,之后每一日的计算只要简单得将前一日的平均真实价格范围带入上述公式即可。
-
ARC
ARC = ATR * C
C是一个[2.8, 3.1]之间的常数(一般为3)。
-
系统交易规则
计算出七天的ARC,找出七天最高收盘价SIC,SAR = SIC - ARC
若第二日的收盘价低于SAR,平仓建立空头。
真实价格范围
取以下三种的最大值。
- 当日最高价到当日最低价的范围。
- 昨日收盘价到当日最高价的范围。
- 昨日收盘价到当日最低价的范围。
代码实现
1
2
3
4
5
6
7
8
9
10
11
12
13
14
15
16
17
18
19
20
21
22
23
24
25
26
27
28
29
30
31
32
33
34
35
36
37
38
39
40
41
42
43
44
45
46
47
48
49
50
51
52
53
54
55
56
57
58
59
60
61
62
63
64
65
66
67
68
69
70
71
72
73
74
75
76
77
78
79
80
81
82
83
84
85
86
87
88
89
90
91
92
93
94
95
96
97
98
99
100
101
102
103
104
105
106
107
|
const C = 3
const DATA_SOURCE: {
state: 1 | -1
TR: number
ATR: number
ARC: number
SAR: number
SIC: number
high: number
close: number
low: number
open: number
date: string
} = []
function getHistoryData(start, end) {
const date = new Date()
return [{
high,
open,
low,
close,
date: `${date.getFullYear()}-${date.getMonth() + 1}-${date.getDate()}`
}]
}
function getTR(currentData, yestodayData) {
const abs = Math.abs
return Math.max(abs(currentData.high - currentData.low), abs(currentData.high - yestodayData.close), abs(currentData.low - yestodayData.close))
}
function dailyFunction() {
const currentDateData = getHistoryData()
if(DATA_SOURCE.length < 7) {
if(DATA_SOURCE.length < 6) {
DATA_SOURCE.push({
...currentDateData,
TR: getTR()
})
}else {
const TR = getTR()
const ATR = DATA_SOURCE.map(item => item.TR).reduce((acc, cur) => acc + cur, 0) / 7
DATA_SOURCE.push({
...currentDateData,
TR,
ATR,
ARC: ATR * C
})
}
}
const [lastDayData] = DATA_SOURCE.slice(-1)
const todayTR = getTR(currentDateData, lastDayData)
const todayATR = (6 * lastDayData.ATR + todayTR) / 7
const ARC = todayATR * C
let SIC
let SAR
let state
if(lastDayData.state == -1) {
SIC = Math.min(lastDayData.SIC, currentDateData.close)
SAR = lastDayData.SIC + lastDayData.ARC
state = currentDateData.close > SAR ? 1 : -1
if(state === 1) {
SIC = currentDateData.close
}
}
else {
SIC = Math.max(lastDayData.SIC, currentDateData.close)
SAR = lastDayData.SIC - lastDayData.ARC
state = currentDateData.close < SAR ? -1 : 1
if(state === 1) {
SIC = currentDateData.close
}
}
const newData = {
...currentDateData,
TR: todayTR,
ATR: todayATR,
ARC,
SIC,
SAR,
state
}
DATA_SOURCE.push(newData)
}
|
动向指标
根据一个0-100的指标来跟踪产品趋势。
几个指标概念
+DM和-DM
今日的价格范围与昨日价格返回的差值
比如:昨天的价格范围是[100 200],今日的价格范围是[150, 300],则使用+DM表示为300 - 200 = 100
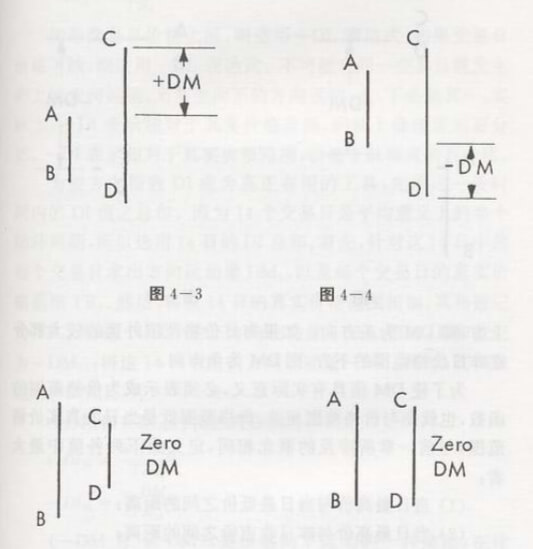
当今日与昨日是包含关系时,DM为0。
+DM和-DM始终是正数。
计算规则
党日价格范围超出昨日价格范围中的较大部分。
+DI和-DI
方向指数,相对于真实价格范围,变动的百分比。

价格上涨用+DI,下跌用-DI。

求出14天的平均值来作为指标,
计算出14天的值以后便可以用简便方法进行计算。

DX
动向指标
DX = DIDiff / DISum(参数详见下表)
DX值越大,运动越强;DX值月销,运动越弱。
无论价格向上或向下运动,不会影响数值,即向上或向下运动幅度大,那么他的值都很大。
ADX
14天DX的平均值
ADXR
方向运动的坐标系上用于量度期货、货币、股票等等的价格变化的一个指标
ADXR = (当日ADX + 14天前的ADX14) / 2
CSI & K
- CSI
根据相关关联参数计算而得来的产品选择指标
- K
与CIS相关的常量系数
数据记录
| date |
open |
high |
low |
close |
TR |
DMHigh |
DMLow |
TR14 |
DI14High |
DI14Low |
DIDiff |
DISum |
DX |
ADX |
| 日期 |
开盘价 |
最高价 |
最低价 |
收盘价 |
真实价格范围 |
+DM |
-DM |
TR14 |
+DI14 |
-DI14 |
+DI14 - (-DI14) |
+DI14 + (-DI14) |
DIDiff / DISum |
14天DX的平均值 |
js实现
1
2
3
4
5
6
7
8
9
10
11
12
13
14
15
16
17
18
19
20
21
22
23
24
25
26
27
28
29
30
31
32
33
34
35
36
37
38
39
40
41
42
43
44
45
46
47
48
49
50
51
52
53
54
55
56
57
58
59
60
61
62
63
64
65
66
67
68
69
70
71
72
73
74
75
76
77
78
79
80
81
82
83
84
85
86
87
88
89
90
91
92
93
94
95
96
97
98
99
100
101
102
103
104
105
106
107
108
109
110
111
112
113
114
115
116
117
118
119
120
121
122
123
124
125
126
127
128
129
130
131
132
133
134
135
136
137
138
139
140
141
142
143
144
145
146
147
148
149
150
151
152
153
154
155
156
157
158
159
160
161
162
163
164
165
166
167
168
169
170
171
172
173
174
175
176
177
178
179
180
181
182
183
184
185
186
187
188
189
190
191
192
193
194
195
196
197
198
199
200
201
202
203
204
205
206
207
208
209
210
211
212
213
214
215
216
217
218
219
220
221
222
223
224
225
226
227
228
229
230
231
232
233
234
235
236
237
238
239
240
241
242
243
244
245
246
247
248
249
250
251
252
253
254
255
256
257
258
259
260
261
262
263
264
265
266
267
268
269
270
271
272
273
274
275
276
277
278
279
280
281
282
283
284
|
const DATA_SOURCE = []
const TRADE_INFO = {
status: -1,
limit: -1,
}
const RANGE_DAY_COUNT = 14
function getHistoryData(start, end) {
const date = new Date()
return [{
high,
open,
low,
close,
date: `${date.getFullYear()}-${date.getMonth() + 1}-${date.getDate()}`,
charge,
}]
}
function getDMData(currentData, yestodayData) {
const {
high: currHigh,
low: currLow
} = currentData
const {
high,
low
} = yestodayData
let DMHigh = 0
let DMLow = 0
const condition1 = currHigh - high
const condition2 = low - currLow
if(condition1 > 0 || condition2 > 0) {
if(condition1 > condition2) {
DMHigh = condition1
}
else {
DMLow = condition2
}
}
return {
DMHigh,
DMLow
}
}
function getTR(currentData, yestodayData) {
const abs = Math.abs
return Math.max(abs(currentData.high - currentData.low), abs(currentData.high - yestodayData.close), abs(currentData.low - yestodayData.close))
}
function dailyFunction() {
const currentData = getHistoryData()
const {
high,
open,
low,
close,
date,
charge
} = currentData
const newData = {
date,
high,
open,
close,
low,
charge
}
if(!DATA_SOURCE.length) {
const yestoday = DATA_SOURCE[DATA_SOURCE.length - 1]
const { DMHigh, DMLow } = getDMData(newData, yestoday)
newData.DMHigh = DMHigh
newData.DMLow = DMLow
const tr = getTR(newData, yestoday)
newData.TR = tr
if(DATA_SOURCE.length >= (RANGE_DAY_COUNT - 1)) {
if(DATA_SOURCE.length == (RANGE_DAY_COUNT - 1)) {
const previousData = DATA_SOURCE.slice(DATA_SOURCE.length - RANGE_DAY_COUNT - 1)
newData.TR14 = tr + previousData.reduce((acc, cur) => {
acc += cur.TR
return acc
}, 0)
newData.DMHigh14 = DMHigh + previousData.reduce((acc, cur) => {
acc += (cur.DMHigh || 0)
return acc
}, 0)
newData.DMLow14 = DMLow + previousData.reduce((acc, cur) => {
acc += (cur.DMLow || 0)
return acc
}, 0)
}
else {
const { TR14, DMHigh14, DMLow14 } = yestoday
newData.TR14 = TR14 - TR14 / RANGE_DAY_COUNT + tr
newData.DMHigh14 = DMHigh14 - DMHigh14 / RANGE_DAY_COUNT + DMHigh
newData.DMLow14 = DMLow14 - DMLow14 / RANGE_DAY_COUNT + DMLow
}
newData.ATR14 = newData.TR14 / 14
newData.DI14High = newData.DMHigh14 / newData.TR14 * 100
newData.DI14Low = newData.DMLow14 / newData.TR14 * 100
newData.DIDiff = Math.abs(newData.DI14High - newData.DI14Low)
newData.DISum = newData.DI14High + newData.DI14Low
newData.DX = newData.DIDiff / newData.DISum * 100
if(DATA_SOURCE.length >= (RANGE_DAY_COUNT * 2 - 1)) {
if(DATA_SOURCE.length == (RANGE_DAY_COUNT * 2 - 1)) {
const previousData = DATA_SOURCE.slice(DATA_SOURCE.length - RANGE_DAY_COUNT - 1)
newData.ADX = (newData.DX + previousData.reduce((acc, cur) => {
acc += cur.DX
return acc
}, 0)) / RANGE_DAY_COUNT
}
else {
const { ADX } = yestoday
newData.ADX = (ADX * (RANGE_DAY_COUNT - 1) + newData.DX) / RANGE_DAY_COUNT
}
}
if(DATA_SOURCE.length >= RANGE_DAY_COUNT * 3) {
newData.ADXR = (newData.ADX + newData[newData.length - RANGE_DAY_COUNT]) / 2
newData.CSI = newData.ADXR * newData.ATR14 * ( 100 / 1 * (1 / 150 + newData.charge) ) * 100
}
}
}
if(DATA_SOURCE.length >= RANGE_DAY_COUNT * 3) {
if(newData.ADXR > 25 && newData.CSI > 400) {
if(newData.ADX < newData.DI14High && newData.ADX < newData.DI14Low) {
if(TRADE_INFO.status === 1) {
TRADE_INFO.status = 0
TRADE_INFO.limit = newData.high
}
}
else if(newData.DI14High > newData.DI14Low) {
if(TRADE_INFO.status === -1 || newData.low < TRADE_INFO.limit) {
TRADE_INFO.status = 1
TRADE_INFO.limit = newData.high
}
}
else if(newData.DI14High < newData.DI14Low) {
if(TRADE_INFO.status === -1 || newData.high > TRADE_INFO.limit) {
TRADE_INFO.status = 0
TRADE_INFO.limit = newData.low
}
}
}
}
DATA_SOURCE.push(newData)
}
|
存在问题
- 上面
ADXR超过25才是有利可图,但是如果在产品的ADXR超过25时买入,但是之后降低到了25以下,此时,入市的资金该如何处理。
- 大趋势下,如持续上涨,是否需要对持续DI交叉做更多的资金买入。
- 具体的交易操作还可以根据ADX来进行更细致的判断,更多细节有待接着研究(55页)。
- 上述代码需要一个特殊的指标
CSI,可能在第九章有讲到,待阅读😁 (经过阅读,九章中对于CSI的定义是越高越好,但是做的是一个相对比较,并没有明确说明高于某一个值表示有利可图,待考证)。
期货品种选择指标CSI
为什么先写这一章,因为他跟前面第四章有关(但是也没有那么有关)。
ps
因为本人并没有想去做期货等相关的交易,所以可能对于本章,作用不大,简单带过。
公式

- ADXR
第四章中提到的动向指标。
- ATR14
14天的平均真实价格范围。
根据前面基本概念中提到的TR计算而来。
- V
每运动1分(货币单位)、实际代表的价值(即以货币单位计量的ATR14的基本增幅)
笔者理解的意思应该就是市场每运动一个货币单位时,每份合约所发生的价格变动(那在股票中是不是就是一手的意思)。
- M
保证金数量
- C
手续费
总结
根据上面的公式以及书中的介绍,`CSI`越高,说明交易越有利,并且可能风险也更小。
(本人因为可能交易的是股票,所以上面的保证金并不存在)。
动量概念-趋势平衡点交易系统
几个概念
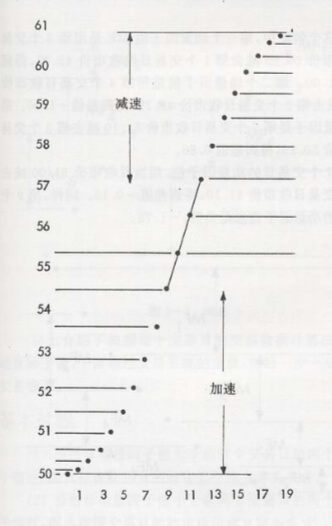
MF
动量因子,描述价格变化的加速度,比如昨天比前天增加了1块,今天比昨天多增加1块的话,动量因子为0,因为加速度没有发生变化。
TBP
趋势平衡点
AverageX
最高价、最低价、收盘价的平均值
ProtectStop
防御停损点
指定当价格达到点时停止头寸。
- 空头:
ProtectStop = AverageX + TR
- 多头:
ProtectStop = AverageX - TR
TargetPoint
目标价位
指定当价格到达指定获利位置时停止头寸
- 空头:
2 * AverageX - H
- 多头:
2 * AverageX - L
L & H表示最低和最高价
交易过程
- 当日MF > 昨日MF && 当日MF > 前天MF
多头
- 当日MF < 昨日MF && 当日MF < 前天MF
空头
- 目标价位了结,不做反向交易
- 停止点结束交易,不做反向交易
- 了结后再次进入遵循
1、2规则
js实现
1
2
3
4
5
6
7
8
9
10
11
12
13
14
15
16
17
18
19
20
21
22
23
24
25
26
27
28
29
30
31
32
33
34
35
36
37
38
39
40
41
42
43
44
45
46
47
48
49
50
51
52
53
54
55
56
57
58
59
60
61
62
63
64
65
66
67
68
69
70
71
72
73
74
75
76
77
78
79
80
81
82
83
84
85
86
87
88
89
90
91
92
93
94
95
96
97
98
99
100
101
102
103
104
105
106
107
108
109
110
111
112
113
114
115
116
117
118
119
120
121
122
123
124
125
126
127
128
129
|
const DATA_SOURCE = []
const TRADE_INFO = {
status: -1,
}
function getTR(currentData, yestodayData) {
const abs = Math.abs
return Math.max(abs(currentData.high - currentData.low), abs(currentData.high - yestodayData.close), abs(currentData.low - yestodayData.close))
}
function getHistoryData(start, end) {
const date = new Date()
return [{
high,
open,
low,
close,
date: `${date.getFullYear()}-${date.getMonth() + 1}-${date.getDate()}`
}]
}
function dailyFunction() {
const currentData = getHistoryData()
const {
high,
open,
low,
close,
date,
charge
} = currentData
const newData = {
date,
high,
open,
close,
low,
charge,
AverageX: (high + low + close) / 3
}
if(DATA_SOURCE.length >= 1) {
newData.TR = getTR(newData, DATA_SOURCE[DATA_SOURCE.length - 1])
}
if(DATA_SOURCE.length >= 2) {
const [beforeYestoday, yestoday] = DATA_SOURCE.slice(-2)
newData.MF = newData.close - beforeYestoday.close
if(DATA_SOURCE.length >= 4) {
if(
(TRADE_INFO == 1 && newData.close < yestoday.ProtectStop)
||
(TRADE_INFO == -1 && newData.close > yestoday.ProtectStop)
||
(TRADE_INFO == 1 && newData.close > yestoday.TargetPoint)
||
(TRADE_INFO == -1 && newData.close < yestoday.TargetPoint)
) {
TRADE_INFO.status = -1
}
else if(newData.MF > beforeYestoday.MF && newData.MF > yestoday.MF) {
if(TRADE_INFO.status !== 1) {
TRADE_INFO.status = 1
}
}
else if(newData.MF < beforeYestoday.MF && newData.MF < yestoday.MF) {
if(TRADE_INFO.status !== 0) {
TRADE_INFO.status = 0
}
}
if(TRADE_INFO.status === 1) {
newData.ProtectStop = newData.AverageX - newData.TR
newData.TargetPoint = 2 * newData.AverageX - newData.low
}else if(TRADE_INFO.status === 0) {
newData.ProtectStop = newData.AverageX + newData.TR
newData.TargetPoint = 2 * newData.AverageX - newData.high
}
}
}
DATA_SOURCE.push(newData)
}
|
存在问题
- 关于上面的了结头寸的说法,对于空头和多头来说,不太能理解,空头和退出市场的区别在哪里。
相对强弱指数
通过一个相对指标概念来描述所有产品的价格震荡情况。
通过描述该指标可以看到哪个产品的价格变动是有利可图
几个概念
RSI
相对强弱指数

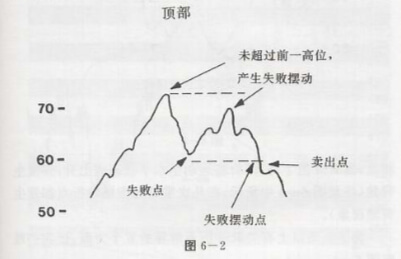
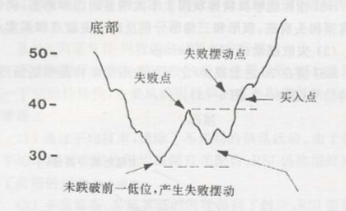
70以上或者30以下表示市场的顶部或底部,即将反转的信号。
js实现
1
2
3
4
5
6
7
8
9
10
11
12
13
14
15
16
17
18
19
20
21
22
23
24
25
26
27
28
29
30
31
32
33
34
35
36
37
38
39
40
41
42
43
44
45
46
47
48
49
50
51
52
53
54
55
56
57
58
59
60
61
62
63
64
65
66
67
68
69
70
71
72
73
74
75
76
77
78
79
80
81
82
83
84
85
86
87
88
89
90
91
92
93
94
95
96
97
98
99
100
101
102
103
104
105
106
107
108
109
110
111
112
113
114
115
116
117
118
119
120
121
122
123
|
const DATA_SOURCE = []
const TRADE_INFO = {
status: -1,
}
function getHistoryData(start, end) {
const date = new Date()
return [{
high,
open,
low,
close,
date: `${date.getFullYear()}-${date.getMonth() + 1}-${date.getDate()}`,
charge,
}]
}
function dailyFunction() {
const currentData = getHistoryData()
const {
high,
open,
low,
close,
date,
charge
} = currentData
const newData = {
date,
high,
open,
close,
low,
charge
}
if(!!DATA_SOURCE.length) {
const [ yestodayData ] = DATA_SOURCE.slice(-1)
if(newData.close > yestodayData.close) {
newData.rise = newData.close - yestodayData.close
}
else {
newData.fall = yestodayData.close - newData.close
}
}
if(DATA_SOURCE.length >= 14) {
if(DATA_SOURCE.length === 14) {
const { rise, fall } = DATA_SOURCE.reduce((acc, cur) => {
acc.rise += (cur.rise || 0)
acc.fall += (cur.fall || 0)
return acc
}, {
rise: 0,
fall: 0
})
newData.riseAverage = rise / 14
newData.fallAverage = fall / 14
newData.RS = newData.riseAverage / newData.fallAverage
newData.RSI = 100 - (100 / (1 + newData.RS))
}
else {
const [ yestodayData ] = DATA_SOURCE.slice(-1)
if(newData.close > yestodayData.close) {
newData.rise = newData.close - yestodayData.close
}
else {
newData.fall = yestodayData.close - newData.close
}
newData.riseAverage = (yestodayData.riseAverage * 13 + (yestodayData.rise || 0)) / 14
newData.fallAverage = (yestodayData.fallAverage * 13 + (yestodayData.fall || 0)) / 14
newData.RSI = 100 - (100 / (1 + newData.RS))
}
}
DATA_SOURCE.push(newData)
}
|
存在问题
- 文中所说的各种图表形态,如头肩顶|底,旗形,只是简单的使用图例标识何时买入卖出,并没有真正解释计算的方法,暂时还无法完善整个交易流程。
摆动指数-短线交易系统
顾名思义是做短期交易或高频交易的,个人认为对于短线交易来说,需要关注到更多的细节,毕竟在短时间内做多次交易,需要付出更多的手续费。
几个概念
-
Cn、Ln、Hn、On
第n天的收盘价、最低价、最高价、开盘价
-
SI
摆动因子

L表示极限运动值常量(比如3)
K表示下列两数值的最大值(绝对值最大)
R为以下条件之一
- 求出下列三个条件中的最大值(绝对值最大)
1. H2 - C1
2. L2 - C1
3. H2 - L2
- 根据上面的最大值来定义R
1. R = (H2 - C1) - 0.5 * (L2 - C1) + 0.25 * (C1 - O1)
2. R = (L2 - C1) - 0.5 * (H2 - C1) + 0.25 * (C1 - O1)
3. R = (H2 - L2) + 0.25 * (C1 - O1)
-
ASI
累计摆动指标
ASI = 今日SI + 前一日ASI
它可以是正数也可以是负数
长期上升可能是正数,下降可能是负数,摆动可能是正负交替
-
HSP
高位摆动点
是由ASI定义的交易日,该交易日的ASI值高于相邻的前后两个交易日的ASI值。
-
LSP
低位摆动点
是由ASI定义的交易日,该交易日的ASI值低于相邻的前后两个交易日的ASI值。
规则
- 初入市
ASI超过前一个高位摆动点的ASI,次日建立多头
ASI跌破前一个低位摆动点的ASI,次日建立空头
- 指标停损反转点
- 多头
- SAR = 前一个LSP
- 新的HSP形成后,SAR = 下一个LSP
- 空头
- SAR = 前一个HSP
- 新的LSP形成后,SAR = 下一个HSP
- 指标尾随停损点
- 多头
最高HSP与(ASI - 60)之间的交易日的收盘价中的最低价
- 空头
最低LSP与(ASI + 60)之间的交易日的收盘价中的最高价
js实现
1
2
3
4
5
6
7
8
9
10
11
12
13
14
15
16
17
18
19
20
21
22
23
24
25
26
27
28
29
30
31
32
33
34
35
36
37
38
39
40
41
42
43
44
45
46
47
48
49
50
51
52
53
54
55
56
57
58
59
60
61
62
63
64
65
66
67
68
69
70
71
72
73
74
75
76
77
78
79
80
81
82
83
84
85
86
87
88
89
90
91
92
93
94
95
96
97
98
99
100
101
102
103
104
105
106
107
108
109
110
111
112
113
114
115
116
117
118
119
120
121
122
123
124
125
126
127
128
129
130
131
132
133
134
135
136
137
138
139
140
141
142
143
144
145
146
147
148
149
150
151
152
153
154
155
156
157
158
159
160
161
162
163
|
const DATA_SOURCE = []
const TRADE_INFO = {
status: -1,
}
const L = 3
let CURRENT_HSP = 0
let CURRENT_LSP = 0
let CURRENT_HIP = 0
let CURRENT_LOP = 0
let NEXT_NEED_STEP = -1
let SAR = 0
function getHistoryData(start, end) {
const date = new Date()
return [{
high,
open,
low,
close,
date: `${date.getFullYear()}-${date.getMonth() + 1}-${date.getDate()}`,
charge,
current,
}]
}
function requestDailyInfoLoop() {
setTimeout(() => {
const currentData = getHistoryData()
const { current } = currentData
if(!!~NEXT_NEED_STEP) {
if(NEXT_NEED_STEP === 0 && current < CURRENT_LOP) {
TRADE_INFO.status = 0
SAR = CURRENT_HIP
}
else if(NEXT_NEED_STEP === 1 && current > CURRENT_HIP) {
TRADE_INFO.status = 1
SAR = CURRENT_LOP
}
NEXT_NEED_STEP = -1
}
requestDailyInfoLoop()
}, 1000)
}
function dailyFunction() {
const currentData = getHistoryData()
const {
high,
open,
low,
close,
date,
charge
} = currentData
const newData = {
date,
high,
open,
close,
low,
charge
}
if(!!DATA_SOURCE.length) {
const [yestoday] = DATA_SOURCE.slice(-1)
const { close: yesClose, open: yesOpen, low: yesLow, high: yesHigh, SI: yesSI, ASI: yesASI } = yestoday
const N = close - yesClose + 0.5 * (close - open) + 0.25 * (yesClose - yesOpen)
const K = Math.max(Math.abs(high - yesClose), Math.abs(low - yesClose))
const RCondition = [Math.abs(high, yesClose), Math.abs(low - yesClose), Math.abs(high - low)]
const maxRCondition = Math.max(...RCondition)
const maxRConditionIndex = RCondition.indexOf(maxRCondition)
const RMap = [
(high - yesClose) - 0.5 * (low - yesClose) + 0.25 * (yesClose - yesOpen),
(low - yesClose) - 0.5 * (high - yesClose) + 0.25 * (yesClose - yesOpen),
(high - low) + 0.25 * (yesClose - yesOpen)
]
const R = RMap[maxRConditionIndex]
const SI = 50 * (N / R) * (K / L)
newData.SI = SI
newData.ASI = SI + (yesASI || 0)
if(DATA_SOURCE.length >= 2) {
if(Math.max(theDayBeforeYestoday.high, yestoday.high, newData.high) === yestoday.high) {
CURRENT_HIP = yestoday.high
}
if(Math.min(theDayBeforeYestoday.low, yestoday.low, newData.low) === yestoday.low) {
CURRENT_LOP = yestoday.low
}
}
if(DATA_SOURCE.length >= 3) {
const [ theDayBeforeYestoday, yestoday ] = DATA_SOURCE.slice(-2)
if(Math.max(theDayBeforeYestoday.ASI, yestoday.ASI, newData.ASI) === yestoday.ASI) {
CURRENT_HSP = yestoday.ASI
NEXT_NEED_STEP = 1
}
if(Math.min(theDayBeforeYestoday.ASI, yestoday.ASI, newData.ASI) === yestoday.ASI) {
CURRENT_LSP = yestoday.ASI
NEXT_NEED_STEP = 0
}
}
}
DATA_SOURCE.push(newData)
}
|
存在问题
- 能力有限,这一章节的内容的代码实现未能全部完成😓。
- 总得来说,这是一个短线操作系统。
资金管理
相信在接受到交易的相关概念的洗礼后,对这一章节的重要性都应该有一定的理解了。
这里就直接定义书中的结论。
- 任何一种期货,其保证金不要超过总资金数量的15%
- 任何时候,保证金不要超过总资金数量的60%()
上述的保证金也可以说是投入的资金量
结束
以上就是书中的所有内容,当然还有挺多可以完善的地方,上面的代码只是一个简单的demo,后续可以继续完善💪🏻。


